Most Shopify inventory forecasting tools give you a number and ask you to believe it. This page does the opposite: here are the seven inputs a demand forecast for a Shopify store is built from, the arithmetic that turns them into a reorder quantity, and five checks you can run when a number looks wrong.
Written August 2026. Formulas below are the ones Proviand runs in production, not a generic textbook model. Shopify behaviour described here was checked in August 2026.
Strip away the marketing and every inventory forecast is the same two-part guess: how fast will this thing sell, and how long until more of it arrives. Everything else is bookkeeping on top of those two numbers.
That matters because the most common complaint about forecasting apps is not that the number is wrong. It is that nobody can tell you why it is that number. You get "order 240" with no way to check it, so you either trust it blindly or ignore it and go back to your gut. Both of those are bad outcomes, and the second one is what actually happens.
So the useful question is not "is this app's AI good". It is "can I reconstruct this number by hand in thirty seconds". If you can, you can spot the input that is wrong. If you can't, you are outsourcing your buying to a stranger.
Units sold per day. Proviand computes it over three trailing windows and blends them:
blended = 0.5 × velocity30 + 0.3 × velocity7 + 0.2 × velocity90
The 30-day window carries the most weight because it is the best compromise between recent and stable. The 7-day window lets a real change in demand show up within a week. The 90-day window stops one hot week from rewriting your buying plan.
One detail that catches people out: each window divides by the days of history that actually exist, not by the window length. A product you launched twenty days ago has its "30-day velocity" divided by 20. Divide by 30 and every new product looks slower than it is, and you under-buy exactly the things that are working.
A month-of-year multiplier. Proviand compares the selling rate in the month you are forecasting into against the average rate across all twelve months, then clamps the result between 0.4 and 2.5 so one spiky December nudges the number instead of dominating it.
Rates rather than totals, because a month that is only half inside your history window would otherwise look like a slow month. That bias reliably kills the factor for the current month, which is the one you care about.
The honest part: a seasonality factor needs roughly a full year of history before it means anything. Below that, Proviand applies a factor of 1 and says so on screen rather than inventing a curve. If an app is confidently seasonal about a store that opened in March, that confidence is manufactured.
Days from sending the purchase order to the stock being on your shelf. Not the number your supplier quotes. The number your supplier achieves, including the week it sat in customs and the two days it took someone to actually receive it.
Proviand defaults to 14 days and lets you override it per supplier and per product. This is the input that is wrong most often, and it is wrong in the expensive direction: a lead time that is 10 days optimistic means every reorder point on that supplier is 10 days of sales too low.
Expressed in days of cover, defaulting to 14. It is the buffer for the week the shipment is late or the week sales run hot. Days rather than units, so it scales with the product instead of needing a separate number per SKU.
What you can actually sell right now. Proviand reads Shopify's available quantity, which already has committed units taken out of it.
Units on orders that are placed but not yet fulfilled. Because on hand comes from Shopify's available quantity, committed units are already excluded. Subtracting them again is a real and common mistake, and it makes you over-order by roughly your open order book.
Stock on its way. Proviand counts two sources and adds them together: Shopify's own incoming quantity, plus the units on your open purchase orders inside Proviand. Draft POs do not count, because a draft is a thought, not a shipment.
Incoming is the input that prevents the classic double order: you order 200 on Monday, the buying table still shows you short on Tuesday, so you order 200 again.
Two pieces of arithmetic. Both are worth knowing by heart.
Reorder point, the level at which you should be placing the order:
reorder point = ceil( daily demand × (lead time days + safety stock days) )
Proviand flags a product when on hand + incoming ≤ reorder point. With the defaults of 14 days lead time and 14 days safety stock, a product selling 3 a day gets flagged at 84 units.
Recommended quantity, an order-up-to level minus what you already have or have coming:
order up to = daily demand × (lead time + target cover + safety stock)
raw quantity = ceil( order up to − (on hand + incoming) )
Target cover defaults to 30 days: how long a new order should last once it lands. That raw quantity is then rounded up to the supplier's minimum order quantity, and up again to a whole number of cases if the product has a case pack. The rounding happens last, and only when the product actually needs reordering.
Two derived numbers fall out of the same inputs. Weeks of cover is on hand ÷ (daily demand × 7), and days to stockout is on hand ÷ daily demand. Both deliberately ignore incoming stock, because they answer "how long until the shelf is empty", not "how long until I am fine".
When a recommendation looks wrong, it is almost always one input rather than the model. In Proviand every row has a "Why?" link that opens the inputs behind that specific number:
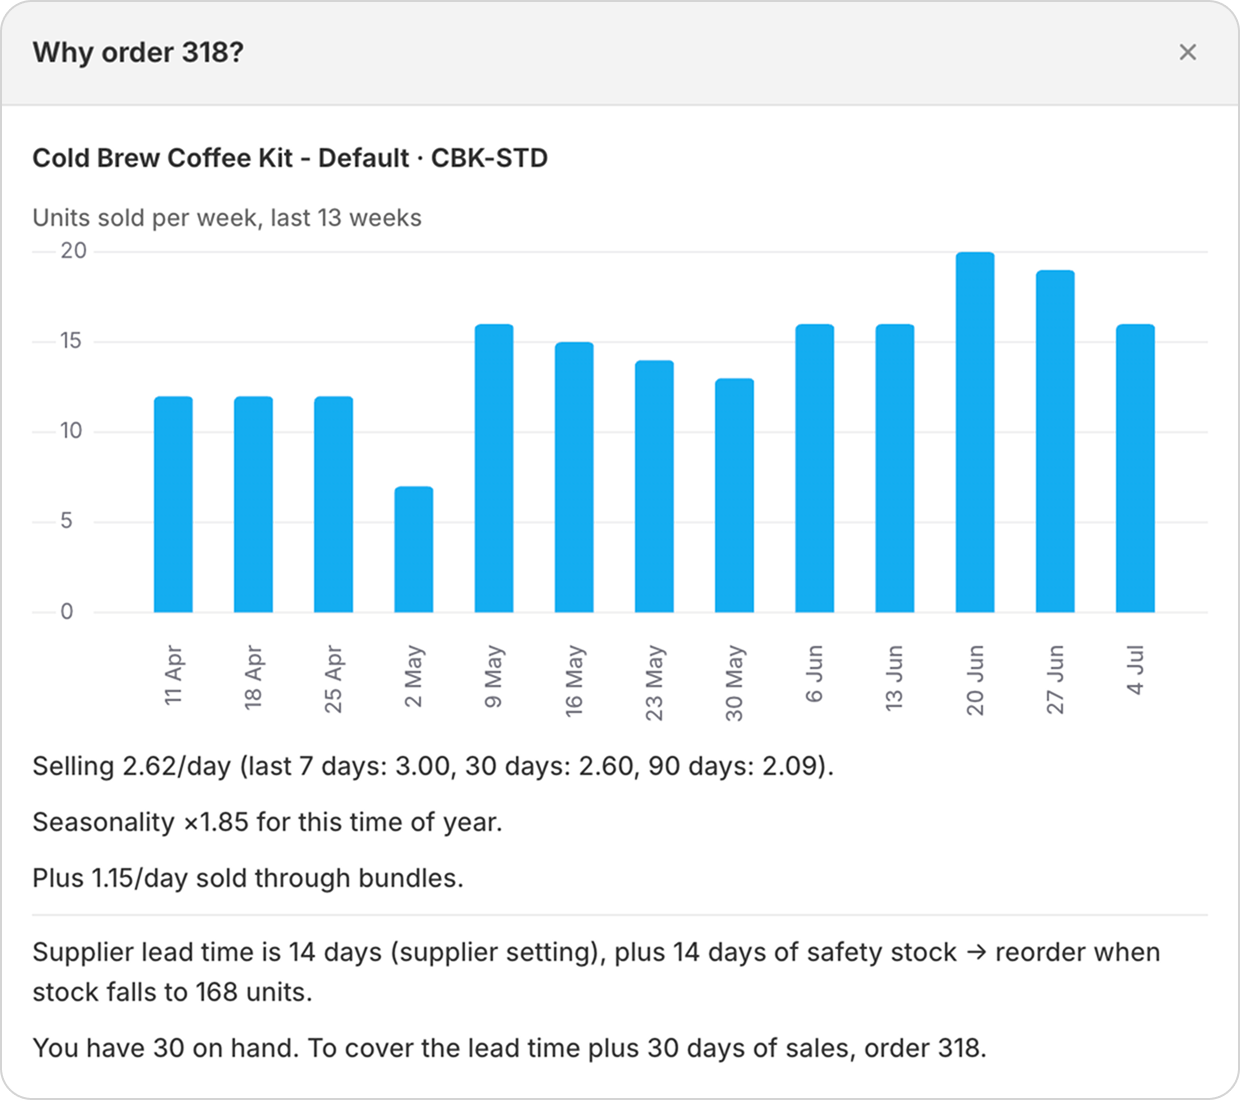
Five checks, in the order that finds the problem fastest:
If a forecasting tool cannot give you those five things for one product in under a minute, that is the finding.
Under about 50 SKUs, with steady sales and lead times inside a couple of weeks, a spreadsheet is fine. Genuinely fine. Sales per week, weeks of cover, a column that goes red under four, and a Friday morning to look at it. You will make the same decisions an app would make, and you will understand them better.
Forecasting software starts earning its cost somewhere around the point where three things are true at once: enough SKUs that the weekly review stops happening, lead times long enough that being wrong costs a month, and more than one location or supplier to keep straight. Below that line, buy the spreadsheet a coffee.
Proviand is also the wrong tool if your demand is driven by things outside your sales history: a store built on drops, a pre-order model, or a catalogue that turns over completely each season. Trailing velocity has nothing useful to say about a product that has never been sold before.
Proviand recalculates every forecast nightly from your Shopify sales history, and shows the inputs behind each one. If you want to check the arithmetic yourself, it is all on screen.
Questions about how a specific number was computed? Email [email protected], happy to walk through it.