Most articles on this open with a Z-score and a service-level table, and lose the reader in the first paragraph. There are two formulas worth knowing. One you can compute today from numbers you already have. The other is more precise, and depends on an assumption about your sales that is often just not true.
Written August 2026. The Proviand behaviour described below was checked against the forecasting engine in production at the time of writing, not against a textbook.
Use the practical formula. It needs four numbers you can pull out of your own history in ten minutes, it has no hidden assumptions, and for a store doing tens or hundreds of orders a day it lands close enough to the statistical answer that the difference is noise.
Reach for the statistical version when you have a genuinely high-volume product with lots of small orders and you want to put a number on the risk you are accepting. Do not reach for it because it looks more rigorous. On lumpy demand it produces a confident number that is wrong, which is worse than an approximate number you know is approximate.
Take one product. You need four numbers, all of which are in your Shopify order history and your PO history.
safety stock = (21 x 27) - (12 x 18) = 567 - 216 = 351 units
Read that as: if demand runs at its worst and the supplier runs at their slowest, at the same time, 351 units is what stands between you and an empty shelf. It is the arithmetic of a bad month, not a statistical construct.
Two things about it are worth saying out loud. First, it assumes the worst case of both at once, which is pessimistic. Genuinely bad demand and genuinely slow delivery are usually independent, so hitting both together is rarer than this formula implies. Second, "max" is doing a lot of work. If your max daily sales came from a single Black Friday, you are now carrying Black Friday safety stock in February. Use the worst ordinary week, not the worst day you have ever had.
The service-level version:
safety stock = Z x standard deviation of demand during lead time
Z is a number from a normal-distribution table. 1.65 for a 95% service level, 2.33 for 99%. The standard deviation of demand during lead time, when the lead time itself is stable, is sigma_daily x sqrt(lead time days).
Same product: say daily demand has a standard deviation of 4.5 units and lead time is a steady 18 days.
sigma_LT = 4.5 x sqrt(18) = 4.5 x 4.24 = 19.1
safety stock at 95% = 1.65 x 19.1 = 32 units
Thirty-two units, against three hundred and fifty-one from the practical formula. That gap is not a mistake in either one. The statistical version is answering a narrower question: it covers ordinary variation in demand, and it assumes the lead time is fixed. The practical version covers a bad demand month and a late supplier together. Most stockouts I have seen came from the supplier, not the demand, which is why the wider number is usually the safer default.
Here is the part that rarely gets said. The Z-score only means what it claims if your daily demand is roughly normally distributed: a lot of days near the average, symmetric tails, no clustering. For a store selling hundreds of units a day across many small orders, that is a fair approximation. For a store selling three or four a day, it is usually false. Real small-store demand is lumpy: long stretches of zero, then a wholesale order for forty. That distribution has a fat right tail and a floor at zero, and a formula built on a symmetric bell curve will systematically understate the stock you need to survive the lumps.
If your sales for a product look like 0, 0, 2, 0, 1, 0, 0, 40, 0, 1, the standard deviation is real arithmetic but the 95% claim attached to it is fiction. You do not have a 95% chance of covering demand. You have a number that would be right if your sales looked like something they do not.
The gap between 95% and 99% looks like a maths choice and is not. Going from 1.65 to 2.33 is a 41% increase in the safety stock you carry, and therefore in the cash sitting on your shelf for that product, forever. What you buy with it is fewer stockouts on roughly one order in twenty versus one in a hundred.
Worth 99%: a product people came to you specifically for, where being out sends them to a competitor and they do not come back. A component that halts your own assembly. Anything with an overseas supplier where the recovery from a stockout is a ten-week round trip rather than a phone call.
Fine at 95% or lower: a reliable domestic supplier who can restock you in three days, a product with close substitutes in your own catalogue, anything where a customer will happily wait or take the other colour. If your supplier is 45 minutes away and delivers on Tuesdays, high safety stock is buying insurance against a risk that barely exists.
The mistake is picking one service level and applying it to the whole catalogue. That is how stores end up simultaneously overstocked on the boring products and out of the ones that matter.
Safety stock exists to absorb two kinds of variation, and both of them live at different levels of your catalogue.
Demand variability is per product. A staple that sells 12 a day every day needs almost nothing. A product that swings between 2 and 40 needs a lot, at the same average.
Supply variability is per supplier. Every product from a supplier who is sometimes three weeks late inherits that risk, whatever their individual sales look like. This is why one global safety stock setting across a mixed catalogue is the most expensive default in this category: you end up padding the reliable supplier's products to protect against the unreliable one.
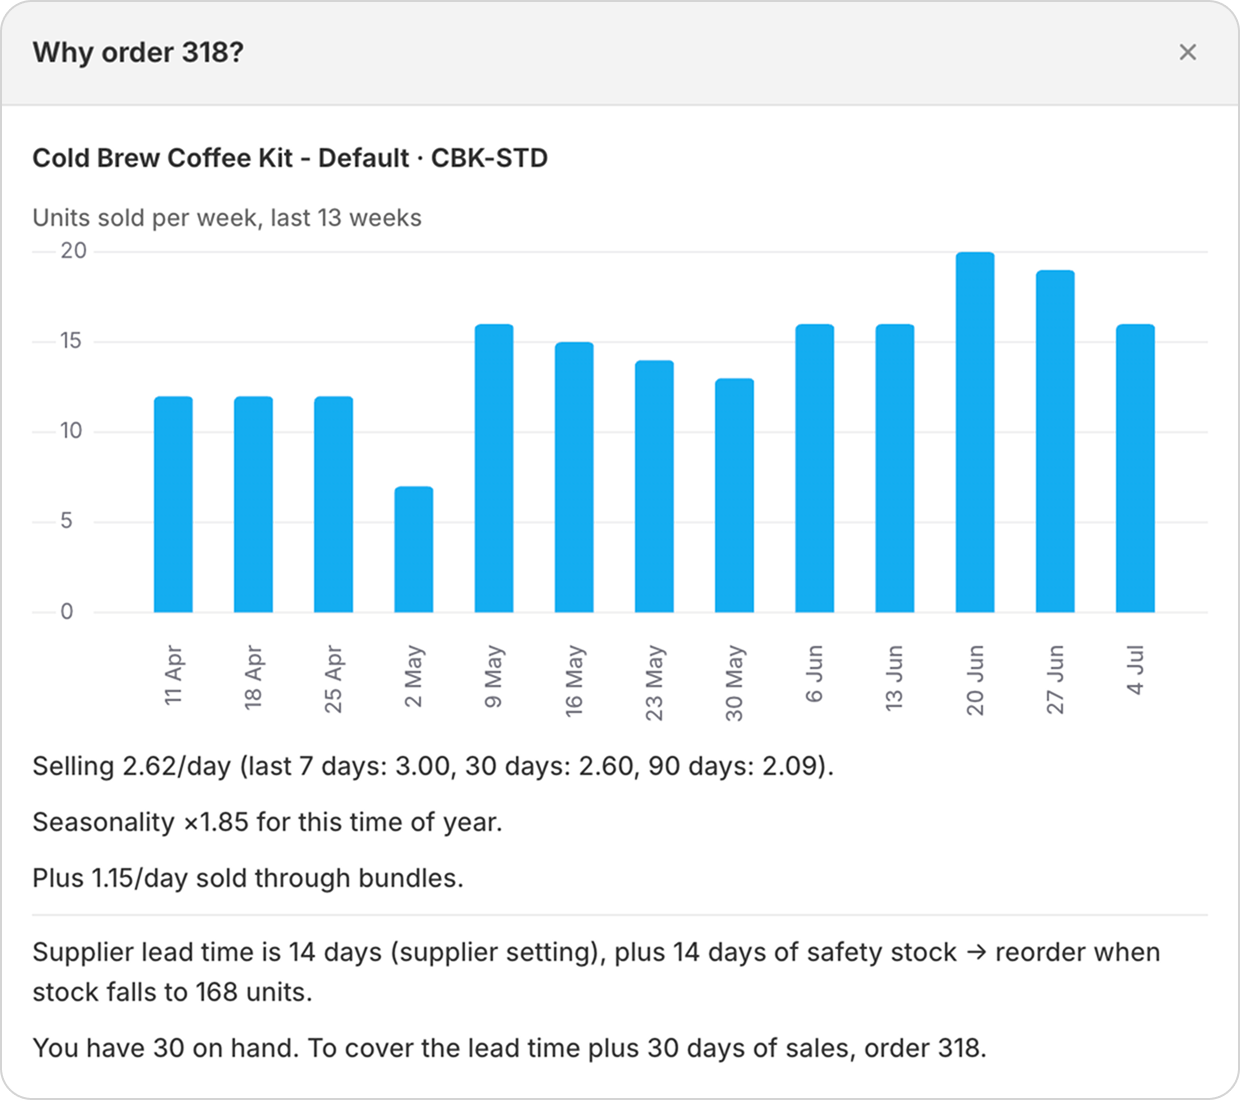
In Proviand safety stock is expressed in days of cover rather than units, defaulting to 14, set shop-wide and overridable per product. That is a deliberate simplification of the formulas above, and it is worth understanding the trade. A safety stock in units goes stale the moment a product speeds up or slows down, and it has to be maintained by hand per SKU. A safety stock in days scales on its own: 14 days of cover is 14 days of cover whether the thing sells 2 a day or 200. It feeds straight into the reorder point:
reorder point = ceil( daily demand x (lead time days + safety stock days) )
What Proviand does not do is compute a Z-score for you. There is no service-level setting, and no standard deviation stored per variant. I would rather ship a number whose inputs you can see on the row than a confident 97.5% that quietly assumes your sales are normally distributed. If you want the statistical number, the formula is above and your own order export has everything you need.
Safety stock is not a virtue. It is cash you have converted into boxes in order to buy down a risk, and sometimes the risk is not worth buying down.
A fast mover with a two-day domestic lead time is the clearest case. If you can be restocked by Thursday, the worst a stockout costs you is a day or two of sales on one product. Carrying weeks of safety stock against that is paying a permanent cost to avoid an occasional small one. Set it low, or effectively off, and spend the cash on the products where a stockout actually hurts.
The same goes for anything perishable or dated, where safety stock does not sit idle so much as expire, and for a product you are deliberately winding down. Padding a product you are trying to stop selling is how you end up with dead stock you chose on purpose.
I would rather you carried less than the formula says on the products where being out is survivable, and used the freed cash to properly cover the two or three products where it is not.
Proviand recomputes cover and reorder points nightly from your Shopify sales history, using whatever lead time and safety stock you set per supplier and per product, and shows the inputs on every row so you can check the arithmetic against this page.
Not sure what safety stock to set for a supplier? Email [email protected] with a couple of products and I will work through it with your numbers.