Every article about reorder points prints the same line and stops there. The formula is the easy part. The two inputs it depends on are where the money is lost, so this page works it through with real arithmetic and shows what happens when each one is off.
Written August 2026. The Proviand formulas below are the ones running in production, checked against the forecasting engine at the time of writing, not a textbook model.
The formula is correct and you can compute it on the back of an envelope. If your reorder points are wrong, the formula is almost never the reason. It is one of two inputs: you used the wrong average for daily sales, or you used the lead time your supplier quoted rather than the one they achieve.
Both errors push in the same direction. Both make the reorder point too low. Too low means the alert fires after it is already too late to act on, which is the specific failure that makes people stop trusting inventory numbers at all.
Proviand runs a slightly different version, and the difference is worth understanding before you compare its numbers to your own spreadsheet:
reorder point = ceil( daily demand x (lead time days + safety stock days) )
Safety stock is expressed in days of cover, not in units. That is the only real departure from the textbook line. It matters because a safety stock in units has to be maintained per product and goes stale the moment a product speeds up or slows down. A safety stock in days scales with the product on its own: 14 days of cover is 14 days of cover whether the thing sells 2 a day or 200.
The default is 14 days of lead time and 14 days of safety stock, both overridable per supplier and per product. A product selling 3 a day gets flagged at 84 units. Proviand raises the flag when on hand + incoming <= reorder point, so stock already on a purchase order counts, and you do not order the same thing twice.
Daily demand is not a single trailing average either. It is a blend of three windows, then adjusted for the month you are buying into:
blended = 0.5 x velocity30 + 0.3 x velocity7 + 0.2 x velocity90
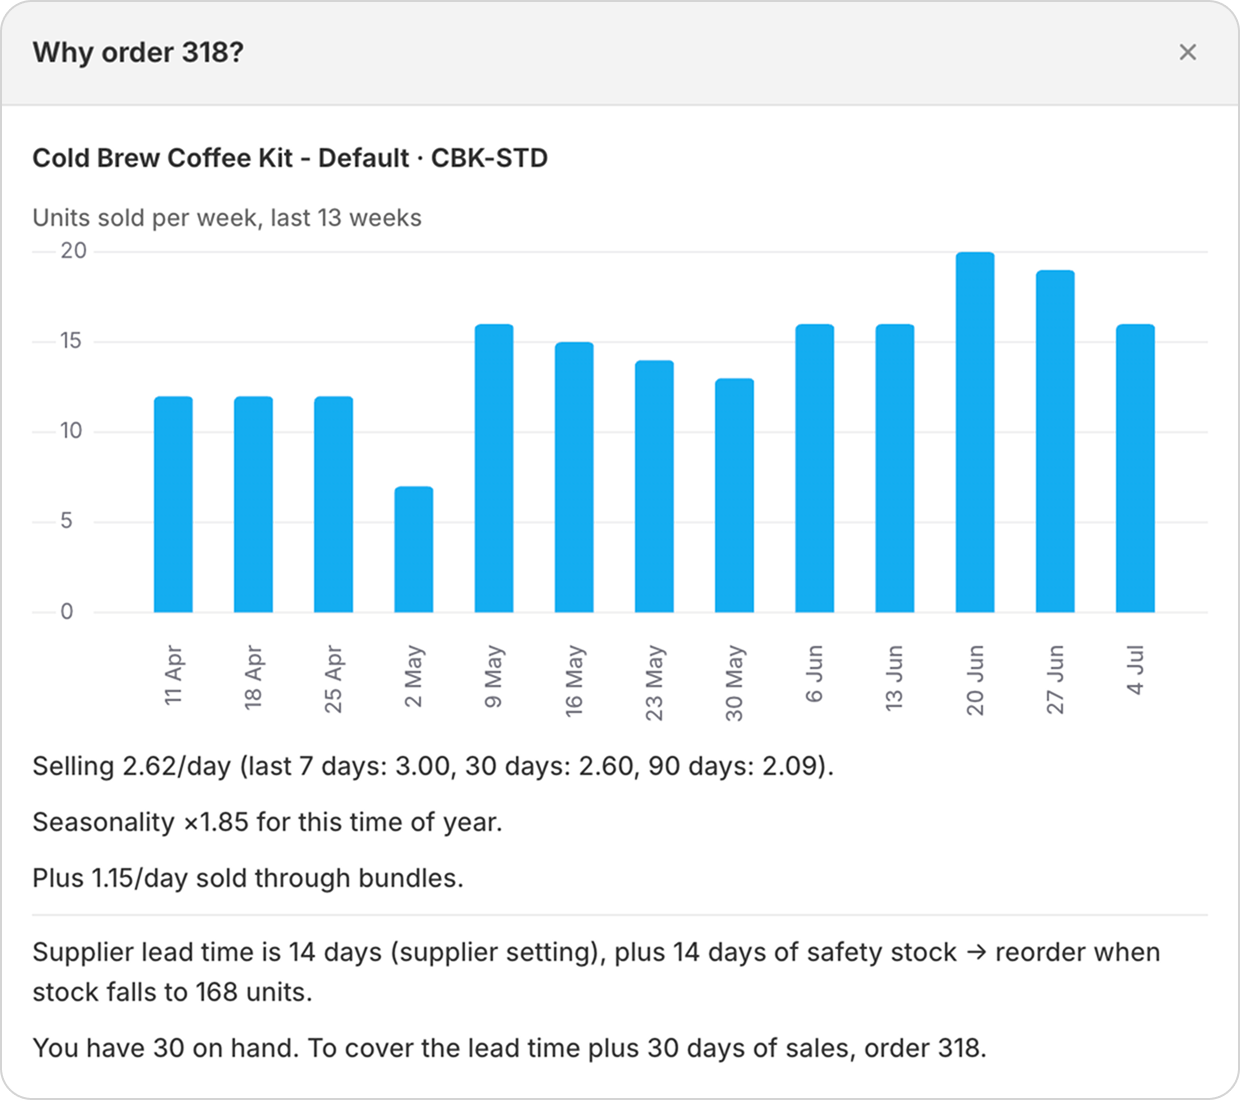
Each row in the buying table shows those inputs, so you can rebuild the number by hand and find the one that is wrong:
Take one SKU, a 500ml bottle of hot sauce, and real numbers rather than round ones.
Blended: 0.5 x 3.2 + 0.3 x 4.0 + 0.2 x 2.8 = 3.36 a day. September has historically sold at 1.15 times the average rate for this product, so daily demand becomes 3.36 x 1.15 = 3.86 a day.
The supplier's last four deliveries took 19, 22, 20 and 23 days from sending the purchase order to the stock being sellable, so lead time is 21 days. Safety stock stays at the default 14 days.
reorder point = ceil( 3.86 x (21 + 14) ) = ceil( 135.2 ) = 136 units
With 150 on hand and nothing incoming, this product is not flagged yet. It has 150 / 3.86 = 38.8 days before the shelf is empty, and the order needs to go out when stock reaches 136, which is about four days from now.
When it does get flagged, the quantity comes from the same inputs. Proviand orders up to a level that covers the lead time, a 30 day target cover window, and the safety buffer:
order up to = 3.86 x (21 + 30 + 14) = 251
raw quantity = ceil( 251 - 150 ) = 102 units
That raw number is then rounded up to the supplier's minimum order quantity and up again to a whole number of cases. With a case pack of 24, 102 becomes 120. The rounding happens last, and only for products that actually need reordering, so a case pack never drags something onto the order that did not need to be there.
"Average daily sales" is not one number, and picking the wrong window is the most expensive quiet mistake in this formula.
A trailing 30 day average is wrong right after a promo. Say that same hot sauce ran a 40% off weekend and sold 70 units in the last 7 days instead of 28. Velocity7 jumps to 10.0, and the blend goes to 0.5 x 3.2 + 0.3 x 10.0 + 0.2 x 2.8 = 5.16, or 5.93 a day after seasonality. The reorder point becomes ceil( 5.93 x 35 ) = 208 units instead of 136.
That is a 72 unit swing out of one discounted weekend, and every unit of it is a bet that discounted demand continues at full price. It will not. Promo weeks pull demand forward as much as they create it, so the weeks after a promo usually run below the old baseline, not above it.
A trailing 30 day average is wrong for a seasonal product in the other direction. Buying for December off a trailing 30 day average taken in October means buying October's rate for December's demand. If December historically sells at 2.4 times the average rate, your reorder point is less than half of what it should be, and you find out on the one weekend of the year where being out of stock actually costs you.
This is why Proviand blends three windows rather than trusting one, and applies a month-of-year factor on top. It also refuses to invent that factor: a seasonality multiplier needs roughly a full year of history before it means anything, and below that Proviand applies a factor of 1 and says on screen that it did. A tool that is confidently seasonal about a store that opened in March is showing you a number it made up.
The practical version, if you are doing this in a spreadsheet: use a longer window than feels natural, exclude promo weeks from the baseline entirely, and compare the month you are buying into against the same month last year rather than against last month.
Lead time is the number of days between you sending the purchase order and the stock being sellable in your store. It is not the number on the supplier's website, and it is not their production time.
The gap is made of the parts nobody counts:
A supplier who quotes 14 days and genuinely ships in 14 days can still be a 21 day lead time for you, and neither of you is wrong. In the worked example above, using the quoted 14 days instead of the observed 21 gives ceil( 3.86 x 28 ) = 109 instead of 136. That is 27 units, and 27 units at 3.86 a day is exactly the 7 days you did not count. You would place the order a week late, every single time, on every product from that supplier.
Getting this right takes no software. Look at your last three or four deliveries from a supplier, count the days from the date you sent the PO to the date the stock went live, and use that number. Do it per supplier, because it varies far more between suppliers than between products. In Proviand it is a per supplier default with a per product override, for exactly that reason.
If you have a few dozen SKUs, steady sales and one or two suppliers with short lead times, a spreadsheet is genuinely fine. Sales per week, a column for days of cover, a conditional format that turns red under three weeks, and half an hour on a Friday. You will make the same calls an app makes, and you will understand them better because you built them.
Where that breaks down is specific. It breaks when there are enough SKUs that the Friday review quietly stops happening. It breaks when lead times get long enough that being wrong costs a month rather than a weekend. And it breaks when different suppliers have genuinely different lead times, because a single lead time column across a mixed catalogue is a rounding error you pay for in stockouts.
Proviand is also the wrong tool if your demand does not come from your sales history: a store built on drops, a pre-order model, or a catalogue that turns over completely every season. A reorder point is a trailing calculation, and it has nothing useful to say about a product that has never been sold.
Proviand recomputes every reorder point nightly from your Shopify sales history, flags the products that crossed the line, and turns them into a purchase order you can send. Every number shows the inputs it came from, so you can check the arithmetic on this page against your own catalogue.
Not sure which lead time to use for a supplier? Email [email protected], happy to work through it with your numbers.